Everybody know these words. You say it when you have to check a microphone which were plugged into some sound system. It’s just test if the microphone is working well and the spoken words are reflected by the amplifier. It’s a simple test to check the functionality of the microphone or the whole sound system. Why should I write about sound systems? No, I don’t try to learn playing a guitar or any other instrument, I like to share some thoughts about software testing. After writing a post about Valgrind, I had the feeling that I should try to show some ways of testing software. In the following post I will analyze what can be tested, what is useful and which tools are available. I don’t aim to make a full overview of software testing itself, I just like to highlight some tools (or thoughts) which are useful and every developer should know of.
Why should I test my software
This is easy to answer. Humans write software and humans tend to make mistakes. Even if something is working perfect, a bug fix or new feature can break it. Testing software will not prevent you from bugs, but it can boost your user satisfaction a lot, by removing errors which are common and avoidable.
What can be tested
First of all, you should think about what should be tested at all. The following list tries to categorizes different tests from a technical perspective:
- Static tests
- Compile time tests
- Runtime test
Also we have to differ between automatic tests and manual tests done by an operator. In the following I will prioritize the automatic tests, simply because once they are setup, they are easier to handle. Manuel tests means, setting up a test plan, making someone responsible for checking the test plan and forcing the test to be done before a release. On the other side automatic tests could be done by a machine at day and night with every software level your application is currently in.
Static tests
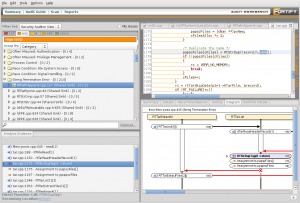
Static tests analyze the code base and try to predict error paths. There are several applications on the market, but most of them are not free. First you need a product which speaks your language. If you develop in C, C++, Java, C# or whatever makes a huge difference here. There are many static analyzer out there which can analyze C, but not many can successfully parse any of the widely used higher programming languages. One of them, which can analyze C++, is Fortify. Fortify uses rules to find different errors a developer can do. There are of course default rules, but a developer can define rules himself. This product is specialized in detecting errors which may end in security holes. One such error in terms of security considerations is file input handling. When one is reading a string directly out of a file, some assumptions are done. Strings in the C/C++ world are zero terminated. All string handling/manipulation function, which are available e.g. from the glibc, are working over the single characters as long as they didn’t find the termination byte. Now, if a developer is reading a string out of a file and doesn’t check if the terminating zero is there, he open a security hole. If an attacker is using this knowledge he is able to provoke a buffer overflow. Fortify can detect such blindly faith to input data. Of course it can detect much more. On the down side, as most software projects are really complex, static code analyzer tend to produce many false/positive. Working through this false/positive and defining filters for the own software project needs much time. On the other side these tools help in finding error paths, which even runtime tests doesn’t show, cause they are so unusual. But exactly these errors are used by attackers to abuse your software for bad things.
Compile time tests
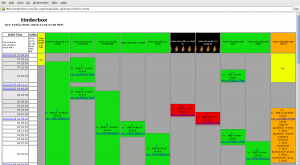
Compile tests make sure your application compiles on different architectures, bit depth, or with other resources like external dependencies (e.g. depending third-party libraries). They are important when you develop for and/or if your team is using different platforms. They make sure a software is at least compiling on every important system. This doesn’t mean the current status works well, it just makes sure every developer involved in the progress of the product is able to build an actual version, even if he is working on a different part of the software itself. Such a situation happens often in open source products, like Mozilla, which invented tinderbox for making these tests. It allows you to set up different build environments for your software and watch the result of every check-in you made in terms of compatibility to this environment. The following shows a screenshot of the Firefox-Ports tinderbox with one broken build box. As everybody know, red is bad:
Red means a burning tree. It shows you that your last check-in doesn’t compile on a specific system. The cool thing is that you can look at the log and spot the error with ease. You know why it doesn’t compile and can fix it. This will prevent you from being blamed by other team members because they can’t work with the current trunk.
Runtime tests
Runtime tests are of course the biggest part of testing. They try to make sure the application does the job it was written for. This also means these tests are the hardest one. It may help to try to separate them as well. I use the following separation:
- Unit tests
- Dynamic analyzer
- GUI tests
Unit tests
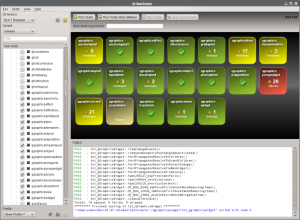
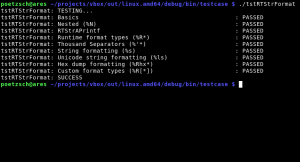
Unit tests check that the specialized functionality a unit provide is working correctly. A well-known example is string handling. String handling is necessary in almost all software projects out there. May it printing the help section of a command line tool or the information presentation in an GUI application. A unit test tries to test anything a user of this unit may do with it. This could be adding a string to another, replacing parts of a string, converting a string to other formats (like to another encoding or to an integer) or much more complex operations like searching within a string with a regular expression. All these operations could be relatively easy tested with unit tests. There is no general usable software out there which could be used for unit testing, but most software frameworks offer some help to write unit tests. Qt has a unit test framework and VirtualBox has a integrated system, as well. Here is a screenshot from a just announced graphical tool by Nokia, which makes spotting errors in Qt unit tests much more easier. The second screenshot shows the output of a VirtualBox unit test.
Please also note that unit testing not just means testing functionality. It could also mean testing performance regression. If some function needed an amount of time in an existing version, it should be at least equal or faster in means of execution time in a new version. Unit tests are evolutionary like the software itself. It is illusionary to believe a unit test is finished sometime. The test will/should grow as long as users will report errors. Often a unit test is called by the bugtracker id, which showed some specific problem the first time.
Dynamic analyzer
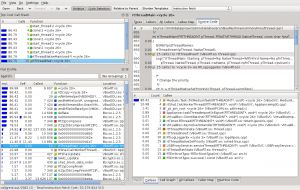
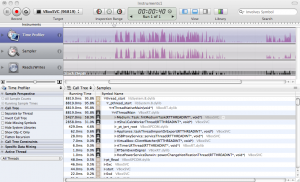
This field of testing is a little bit different from the other one, cause the developer needs to interact here. Although it would be possible to automate some of these tests, they are more designed to be done by the developer from time to time (usually after a feature is completed) to check for some basic errors. The most common dynamic analyzer in the open source world is the Valgrind instrumentation framework. It has a tool for checking memory management errors, like I showed in this post. As already written there, memory leak errors can happen to everyone, so having a tool for finding and eliminating them, is very useful. On the other side there is a tool called Callgrind, which profiles a given software in detail. After profiling some software, a developer is able to see execution times relatively to each other. This makes it possible to find the places an algorithm spend the most time. With this information a developer has the chance to find bottlenecks, which maybe could be eliminated. Beside that, is the knowledge of the call graph sometimes from great information, especially if you develop graphical applications, like in Qt. Having events, slots or asynchrony window systems, like in X11, make it sometimes hard to predict how the code will flow. It may also be helpful in deciding if some subroutine is a candidate for parallel execution. The following screenshot shows the result of analyzing some parts of VirtualBox. To visualize the output of Callgrind (and to interactively work with this data), KCachegrind is the number one tool. The second screenshot shows some similar profiling with Instruments from Xcode.
GUI tests
GUI’s have the advantage to do several tasks in an independent order and users tend to do tasks in a way a developer don’t expect. Developer tends to do tasks in the way they have programmed it. On the other side GUI testing tools do only things they are programmed for. To be honest, we don’t do any automatic GUI testing in VirtualBox. It’s such a wide field and doing it right is hard. Anyway, there are products out there which can be helpful. Qt itself have possibilities for GUI testing build in. Another product is from froglogic. Squish is specialized in GUI testing, especially for Qt applications. But of course there are other tools as well. Just have a look at your preferred build environment.
Conclusion
Testing produces work. It is also something developers don’t like. On the other side it helps to prevent further work by bypassing errors which are preventable. Everybody should ask himself how much time he will sacrifice in setting up test machines or unit tests to make a product much more stable. Errors in freshly released products which don’t happen in an older release are always bad marketing. If there is a chance to prevent them by just adding some lines of code, everyone should use this chance. This post doesn’t show all available tools for testing. For example, the big players like Apple and Microsoft have also testing and analyzing software build into there IDE’s. I just want to give a brief overview what is possible, so that everybody could check the own environment for possibilities of doing testing.
As a last word which touches my personal work environment: Please be assured that we are trying hard to make VirtualBox as stable and save as much as possible ;).
